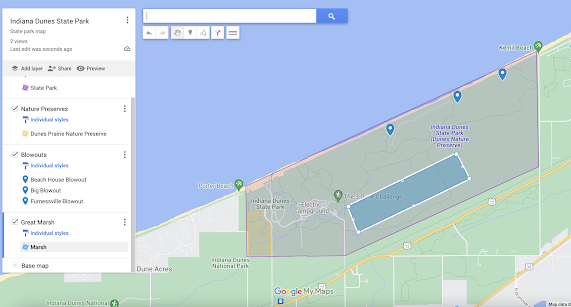
Climate and Weather Information
Climate
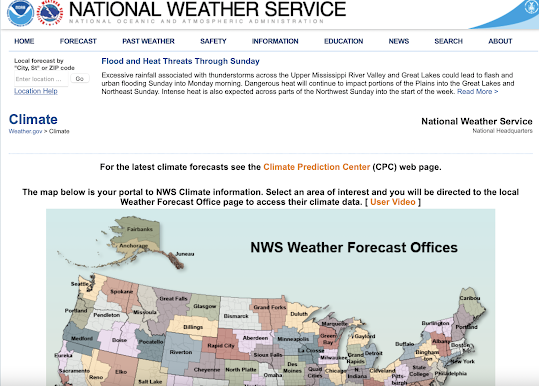
The first site I found was NOAA Climate. This site was easy to navigate and gave me pertinent information for the weather and climate in the area over a specific period of time. It was easy to click on the map and find the information that I need for my area. They did not have the Indiana Dunes State Park but I used the Indiana Dunes National Park, which is located along the board of the State Park. I figured the information for this would be pretty comparable.
From this website, I was able to get the graphs of the daily temperatures along with the charts for the maximum temperatures and minimum temperatures. The graph and the charts are shown below.
The first graph was the daily temperature from January 2022 through July 2022. It shows what the observed temperature for a give day was (dark blue line). It, also, shows the normal temperature range (brown coloring) and the maximum recorded temperatures (red line). I find this information very useful and interesting because I this is the area I live in. It is interesting to see the temperature gradients I have seen over the past year.
Source: Screenshot from NOAA Climate
The next two charts show either the minimum (top chart) or the maximum (bottom chart) temperatures from the year 2000 to the year 2022. The charts, also, state the annual lowest temperature, and the mean, max, and minimum for each month. These charts can be very useful to figure out how much the temperature has changed for the years. Extreme changes in temperature can have an effect on the plants and animal species in the area.
This chart shows the lowest minimum temperatures for the Indiana Dunes National Lakeshore.
Source: Screenshot from NOAA Climate
This chart shows the highest maximum temperatures for the Indiana Dunes National Lakeshore.
Source: Screenshot from NOAA Climate
The last two graphs are the 2022 annual precipitation and snowfalls that have occurred so far this year. You can compare the accumulation (green line) with the normal (brown line), the lowest (red line), and the highest (blue line) levels. The highest and lowest are from the year a respective year depending upon when it happen. These are different for both graphs.
This shows the accumulated precipitation for the Indiana Dunes National Lakeshore.
Source: Screenshot from NOAA Climate
This shows the accumulated snowfall for the Indiana Dunes National Lakeshore.
Source: Screenshot from NOAA Climate
Lake Levels
The next website I visited was the Lake Level Viewer from the NOAA Coast. This website shows you the lake levels for the different Great Lakes. You must select the specific lake you would like to look at and then you can zoom into your area. The first map shows the lake at the current level. You can change the lake levels to see what will happen to the area. It can be moved from lowest to highest levels. The maps below show the current level, lowest level, and then the highest levels.
This is the current levels of Lake Michigan along the Indiana Dunes State Park coastline.
Source: Screenshot from NOAA Coast
This shows what the coast of Lake Michigan along the Indiana Dunes States Park would look like with the lowest levels for the lake.
Source: Screenshot from NOAA Coast
This shows what the coast of Lake Michigan along the Indiana Dunes States Park would look like with the highest levels for the lake.
Source: Screenshot from NOAA Coast
I find these graphs very interesting especially when you can change the levels to see what the possibilities could be. I know from living here and visiting the beach, that the levels change from year to year. Some years the water is very high onto the shorelines cutting into the dunes. Other years, it is very shallow and leaving the beaches with a lot of sand. The changes in water levels really affect housing and other people made structures along the coastline along with the species that inhabit the areas. Tracking this information and seeing how things could change can help people plan for future issues that may arise.
Image Sources
NOAA Climate. (n.d.). Climate [Screenshot of accumulated precipitation graph of the Indiana Dunes State Park from NOAA Climate]. Retrieved from https://www.weather.gov/wrh/climate
NOAA Climate. (n.d.). Climate [Screenshot of accumulated snowfall graph of the Indiana Dunes State Park from NOAA Climate]. Retrieved from https://www.weather.gov/wrh/climate
NOAA Climate. (n.d.). Climate [Screenshot of daily temperatures graph from 2022 of the Indiana Dunes State Park from NOAA Climate]. Retrieved from https://www.weather.gov/wrh/climate
NOAA Climate. (n.d.). Climate [Screenshot of higher maximum temperature chart of the Indiana Dunes State Park from NOAA Climate]. Retrieved from https://www.weather.gov/wrh/climate
NOAA Climate. (n.d.). Climate [Screenshot of lowest minimum temperature chart of the Indiana Dunes State Park from NOAA Climate]. Retrieved from https://www.weather.gov/wrh/climate
NOAA Climate. (n.d.). Climate [Screenshot of opening page of NOAA Climate]. Retrieved from https://www.weather.gov/wrh/climate
NOAA Coast. (2022). Lake Level Viewer [Screenshot of opening page of Lake Level Viewer]. Retrieved from https://coast.noaa.gov/llv/
NOAA Coast. (2022). Lake Level Viewer [Screenshot of the current lake level bordering Indiana Dunes State Park from the Lake Level Viewer]. Retrieved from https://coast.noaa.gov/llv/
NOAA Coast. (2022). Lake Level Viewer [Screenshot of the highest the lake level could go which is bordering Indiana Dunes State Park from the Lake Level Viewer]. Retrieved from https://coast.noaa.gov/llv/
NOAA Coast. (2022). Lake Level Viewer [Screenshot of the lowest the lake level could go which is bordering Indiana Dunes State Park from the Lake Level Viewer]. Retrieved from https://coast.noaa.gov/llv/


Comments
Post a Comment